Graph
Gitbook 插件:使用 function-plot 绘制数学函数图。
[!TIP|style:flat|iconVisibility:hidden|labelVisibility:hidden] npm install gitbook-plugin-graph
https://github.com/cjam/gitbook-plugin-graph
function-plot:https://mauriciopoppe.github.io/function-plot/
book.json
{
    "plugins": [ "graph" ]
}
使用语法
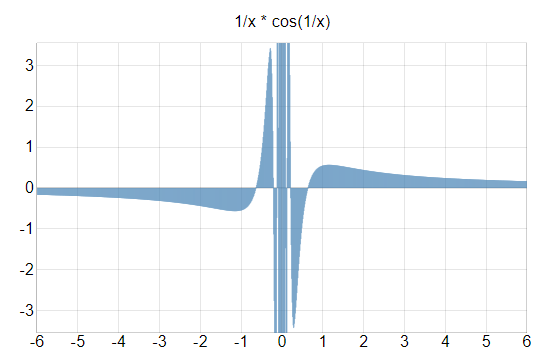
下面是一个示例,需要注意的是 graph 块中的内容必须是合法的 JSON 格式。
{
    "title": "1/x * cos(1/x)",
    "grid": true,
    "xAxis": {
        "domain": [0.01, 1]
    },
    "yAxis": {
        "domain": [-100, 100]
    },
    "data": [{
        "fn": "1/x * cos(1/x)",
        "closed": true
    }]
}
效果如下所示:
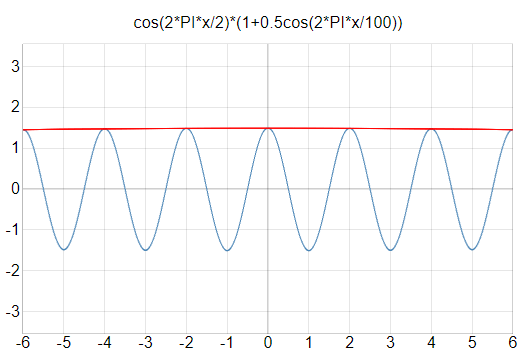
    {
        "title":"cos(2*PI*x/2)*(1+0.5cos(2*PI*x/100))",
        "grid":true,
        "xAxis": {
            "label":"Sample",
            "domain": [0,300]
        },
        "yAxis": {
            "label":"Amplitude",
            "domain": [-1.5,1.5]
        },
        "data": [
            { "fn": "cos(2*PI*x/2)*(1+0.5cos(2*PI*x/100))"},
            { "fn": "(1+0.5cos(2*PI*x/100))"}
        ]
    }